›› Data Visualizations
I am currently a statistician in the Decennial Census Management Division of the U.S. Census Bureau. There I work in wide range of disciplines, including: survey methodology, business analytics, project management, and data dissemination & visualization.
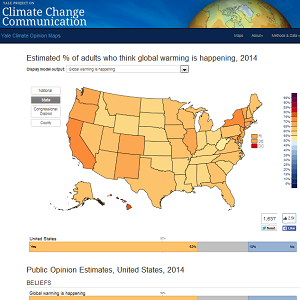
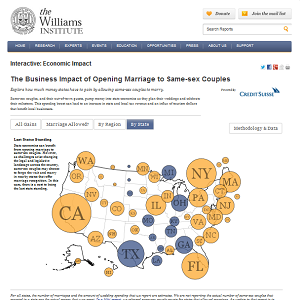
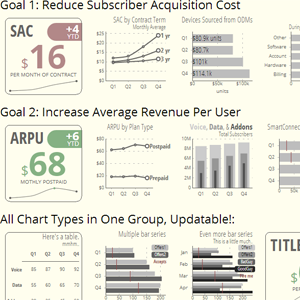
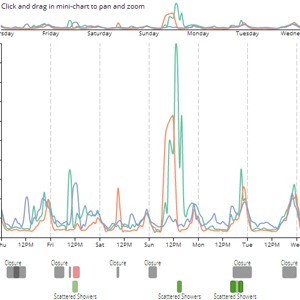
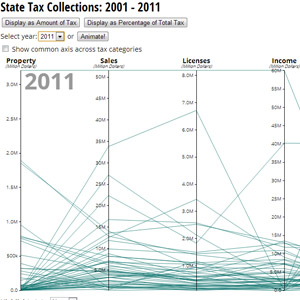
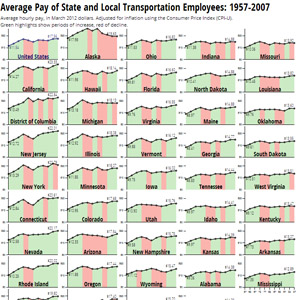
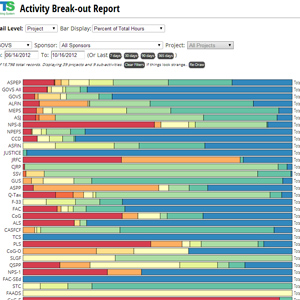
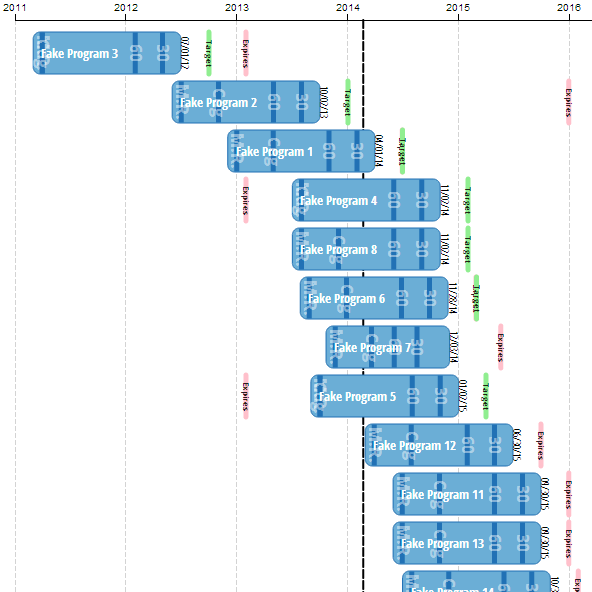
I very much enjoy exploring and visualizing data of all kinds. You can see some examples of visualizations I've created below.
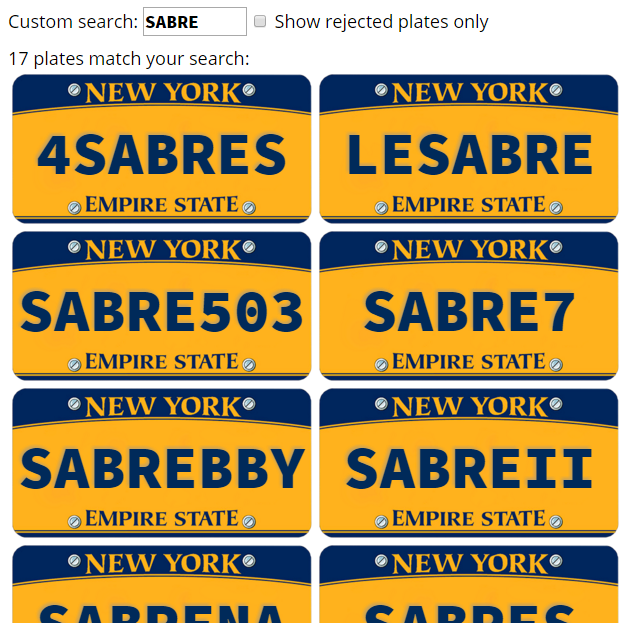
In my spare time, I enjoy the outdoors, and lately have been spending time doing some moderate hiking. I am a fan of NHL hockey, particularly of the Buffalo Sabres.
I live in Alexandria, VA.
I am available for limited part-time data visualization consulting and design work, contact me at synopticviz@gmail.com.

Some feedback on my work: Elance, oDesk, Freelancer